- Research article
- Open access
- Published:
A benchmark example for delamination growth predictions based on the Single Leg Bending specimen under fatigue loading
Advanced Modeling and Simulation in Engineering Sciences volume 7, Article number: 11 (2020)
Abstract
Analysis benchmarking is used to evaluate new algorithms for automated VCCT-based delamination growth analysis. First, existing benchmark cases based on the Single Leg Bending (SLB) specimen for crack propagation prediction under quasi-static loading are summarized. Second, the development of new SLB-based benchmark cases to assess the static and fatigue growth prediction capabilities under mixed-mode I/II conditions is discussed in detail. Additionally, a scheme is proposed to interpolate between known fatigue delamination growth rates to obtain values for mixed-mode ratios for which data has not been defined in the input. Further, a comparison is presented, in which the benchmark cases are used to assess new analysis tools in ABAQUS/Standard FD03. These recently implemented tools yield results that are in good agreement with the benchmark examples. The ability to assess the implementation of new methods in one finite element code illustrates the value of establishing benchmark solutions.
Introduction
Over the past two decades, the use of fracture mechanics has become common practice to characterize the onset and growth of delaminations [1, 2]. In order to predict delamination onset or growth, the calculated strain energy release rate components are compared to interlaminar fracture toughness properties measured over a range from pure mode I loading to pure mode II loading [2].
The virtual crack closure technique (VCCT) is widely used for computing energy release rates based on results from continuum (2D) and solid (3D) finite element (FE) analyses, and to supply the mode separation required when using the mixed-mode fracture criterion [3, 4]. Recently, VCCT was implemented into several commercial finite element codes such as ABAQUS/Standard®, Nastran™, Marc™, and Ansys®. As new methods for analyzing composite delamination are incorporated into finite element codes, the need for comparison and benchmarking becomes important, since each code requires specific input parameters unique to its implementation. A software independent approach based on Linear Elastic Fracture Mechanics (LEFM) was recently presented [5]. The approach allows the assessment of the mode I, II, and mixed-mode I and II, delamination propagation capabilities in commercial finite element codes under static loading which was demonstrated for the implementation in ABAQUS/Standard® [5]. The capabilities of other codes, however, were not assessed at the time. The approach was then extended to allow the assessment of the delamination growth prediction capabilities under fatigue in commercial finite element codes [6]. This approach was similar to the static case. First, benchmark results were created manually using the VCCT implementation in ABAQUS for static onset. Second, using the VCCT-based automated propagation analysis, a delamination in a finite element model was allowed to propagate. In general, good agreement between the results obtained from the FE propagation analysis and the benchmark results could be achieved when the appropriate input parameters were selected.
The objective of the present study is to create new benchmark examples based on the Single Leg Bending specimen (SLB) [7], shown in Fig. 1, and demonstrate the use of these benchmark cases to assess the performance of automated crack propagation prediction capabilities in ABAQUS Standard 2018 FD03 [8]. These capabilities are VCCT-based and allow crack propagation between two user-defined surfaces into a predefined zone of initially tied, coincident node-pairs which are successively released [8]. Mode ratio GII/GT in the SLB specimen can be varied by altering the thicknesses t1 and t2 of the arms. However, unlike other characterization tests for which benchmarks have been published [5], in the SLB specimen, the mode ratio is also dependent on the delamination length, a. Benchmarking, therefore, must be used to assess the appropriate implementation of mixed-mode failure criteria in finite element codes intended to be used for automated crack growth analyses under quasi-static and cyclic loading.

Single Leg Bending specimen (SLB)
In this paper, the development of fatigue benchmark cases based on the SLB specimen with identical and different arm thicknesses, t1 and t2, is presented. First, benchmark cases based on Linear Elastic Fracture Mechanics (LEFM) and VCCT, which have recently been developed for crack propagation prediction under quasi-static loading, are briefly discussed [9]. Second, based on these quasi-static benchmark results, additional benchmark cases to assess delamination propagation under fatigue loading are created. Third, a comparison is presented, in which the benchmark cases are used to assess new analysis tools in ABAQUS/Standard 2018 FD03. Results obtained from VCCT-based, automated fatigue propagation analyses are compared to the benchmark cases. Lastly, the significance of the results is discussed.
Analysis benchmarking
In a previous study, the development of VCCT-based benchmark examples for delamination growth prediction under quasi-static loading was presented in detail [5]. This approach was then extended to allow the assessment of the delamination growth prediction capabilities under fatigue in commercial finite element codes [6]. The examples were based on two-dimensional (2D) and three-dimensional (3D) finite element models of the Double Cantilever Beam (DCB), End-Notched Flexure (ENF) and Mixed-Mode Bending (MMB) specimens. All benchmark examples were designed to be independent of the analysis software used and allow for the assessment of the delamination growth prediction capabilities in commercial finite element codes. To allow further assessment, new SLB-based benchmark examples, were recently created, since they allow variation of the mode ratio GII/GT by altering the thicknesses, t1 and t2, of the arms [9]. In previously published benchmark cases [5], the mixed mode ratio was fixed and almost independent on the delamination length a [10]. In the SLB specimen, however, the mode ratio is dependent on the delamination length which provides an additional challenge to analysis codes with automated delamination propagation capabilities. Simply implementing a criterion in which propagation depends on a fixed critical energy release rate, Gc, is not sufficient in this case. Benchmarking therefore must be used to assess the appropriate implementation of mixed-mode failure criteria in finite element codes intended to be used for automated crack propagation analyses under quasi-static [9] and fatigue loading.
Finite element model
For the current study, SLB specimens made of IM7/8552 graphite/epoxy were modeled with identical and different arm thicknesses, t1 and t2. The material properties were taken from a previous study [5]. An example of the 2D finite element model of the SLB specimens with boundary conditions is shown in Fig. 2a for the symmetric case (t1 = t2) and in Fig. 2b for the unsymmetric case (t2 = 2t1).

Two-dimensional (2D) finite element models of SLB specimens (∆a = 0.5 mm)
Based on previous experience [5], the specimen was modeled with solid plane strain elements (CPE4I) in ABAQUS 2018 FD03 [8] to create the benchmark cases. The SLB specimen was modeled with six elements through the specimen thickness. Along the length, all models were divided into different sections with different mesh refinements. The resulting element lengths at the delamination tip were ∆a = 0.5 mm. Additional models with element length at the delamination tip of ∆a = 2.0 mm were also created to study the effect of mesh density on results from the automated propagation analysis.
An example of a 3D finite element model of the SLB specimen is shown in Fig. 3. Through the thickness, the 3D mesh was identical to the one described above for the 2D model. Along the length and across the width, a uniform mesh with a 1 mm × 1 mm element size, as shown in Fig. 3, was used to avoid potential problems at the transition between a coarse and finer mesh. The specimen was modeled with solid brick elements (C3D8I), which had yielded excellent results in previous studies [5].

Three-dimensional (3D) finite element model of symmetric SLB specimen (∆a = 1.0 mm)
Development of benchmark cases for delamination growth predictions under quasi-static loading conditions
Quasi-static benchmark results can easily be created for any FE analysis software used. The procedure is discussed in detail in a paper on benchmark creation [5] and is condensed here for brevity.
First, finite element models of the specimen with different delamination lengths, a0, were created. For the current example, two-dimensional finite element models simulating the SLB specimen were created with 19 different delamination lengths a0 (10.16 mm ≤ a0 ≤ 80.68 mm).
For each a0 modeled, the load, P, and center deflection, u, at the load point were plotted as shown in Fig. 4, where each thin solid black line represents a different value of a0.
Fig. 4 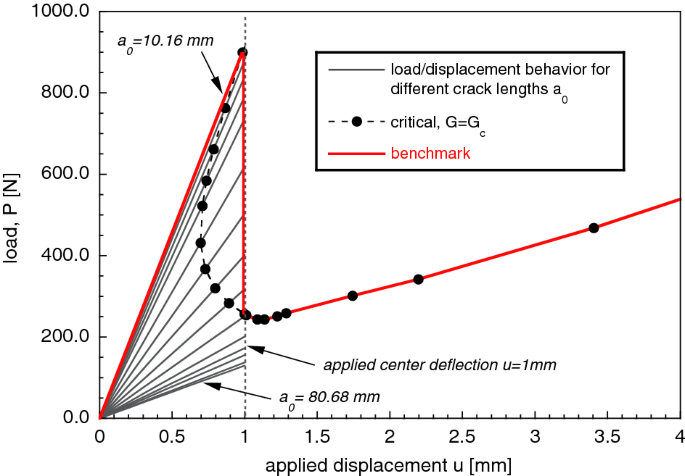
Computed load–displacement behavior of a symmetric SLB specimen for different delamination lengths a0, calculated critical behavior and resulting benchmark case
For each a0 modeled, the total strain energy release rate, GT, and the mixed-mode ratio GII/GT were computed using VCCT for an applied center deflection u = 1.0 mm. In the current case, the mixed-mode ratio is a function of the delamination length, a0, as shown in Fig. 5 (solid blue circles). A closed-form solution developed by Davidson [7] for data reduction yielded a fixed value GII/GT = 0.43 independent of the delamination length which was included in the plot for comparison (dashed grey line).
Fig. 5 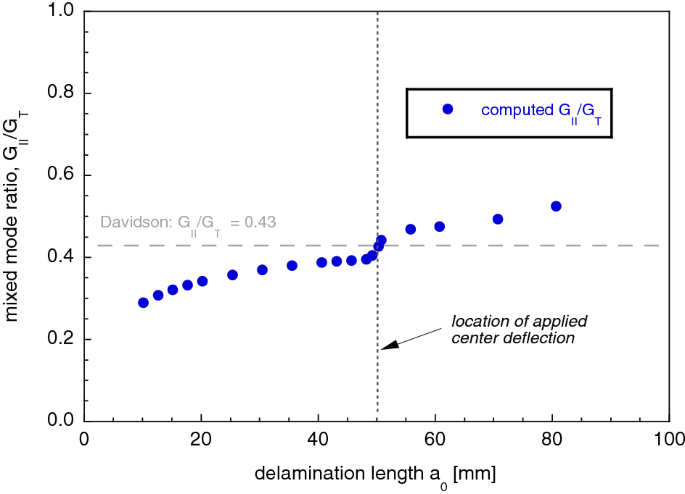
Computed mixed-mode ratio for different delamination lengths, a0, for a symmetric SLB specimen
For each a0 modeled, a failure index, GT/Gc, was calculated by comparing the computed total energy release rate, GT, with the mixed-mode fracture toughness, Gc, of the material, often computed as a function of the mixed-mode ratio. When obtaining the benchmark, Gc should be determined using the same expression for Gc used later in the automated analysis. In the present study, the B–K criterion, suggested by Benzeggah and Kenane [9], was used. It is assumed that the delamination propagates when the failure index reaches unity.
Therefore, the critical load, Pc, and critical opening displacement, uc, can be calculated based on the relationship between load, P, and the energy release rate, G, for a linear system:
$$ \frac{{G_{T} }}{{G_{c} }} = \frac{{P^{2} }}{{P_{c}^{2} }} \Rightarrow P_{c} = P\sqrt {\frac{{G_{c} }}{{G_{T} }}} ;\quad {\text{and}}\quad \frac{{u_{c} }}{2} = \frac{u}{2}\sqrt {\frac{{G_{c} }}{{G_{T} }}} $$(1)For each a0 modeled, the critical load/displacement results were calculated using Eq. (1) and were included in the load/displacement plots as shown in Fig. 4 (solid black circles).
These critical load/displacement results indicated that, with increasing delamination length, less load is required to extend the delamination. For the first ten delamination lengths, a0, investigated, the values of the critical displacements also decreased at the same time. This means that the symmetric SLB specimen exhibits unstable delamination propagation under load control as well as displacement control in this region. The remaining critical load/displacement results pointed to stable propagation.
From these critical load/displacement results (dashed thin black line and solid circles), a benchmark solution (solid red line) can be created as shown in Fig. 4. If the analysis is performed under displacement control (prescribed nodal displacements, u), the applied displacement must be held constant over several increments once the critical point (Pc, uc) is reached, and the delamination front is advanced during these increments. Once the critical path is reached, the applied nodal displacement is increased incrementally.


The procedure outlined above was repeated for the unsymmetric SLB specimen. The computed load/displacement results for the specimens with different a0 (thin solid black lines), the calculated critical behavior (dashed line and solid black circles) and the resulting benchmark case (solid red line) are shown in Fig. 6. For the chosen configuration of the unsymmetric SLB specimen, the mixed-mode ratio is a function of a0, as shown in Fig. 7 (solid blue circle). A closed form solution developed by Davidson [7] for data reduction yielded a fixed value GII/GT = 0.38 independent of the delamination length which was included in the plot for comparison (dashed grey line).

Computed load–displacement behavior of an unsymmetric SLB specimen for different delamination lengths, a0, calculated critical behavior and resulting benchmark case

Computed mixed-mode ratio for different delamination lengths, a0, for an unsymmetric SLB specimen
Development of benchmark cases for delamination growth predictions under cyclic loading conditions (fatigue)
Selection of load levels for the benchmark cases
The fatigue benchmark problem for the SLB specimens were developed as an extension of the static benchmark results. Fatigue load levels were chosen that caused the energy release rate at the front, Gmax, to reach values of 60%, 50%, 40% and 30% of Gc. The corresponding constant loads, Pmax, and displacement, umax, were based on the critical load, Pc, and critical displacement, uc, for the initial delamination length and calculated using Eq. 1. The calculated maximum load, P70,max (70% Pc) and calculated maximum displacement, u70,max (70% uc), are shown in Figs. 8 and 9 (dashed dotted orange line) in relationship to the static benchmark cases (solid grey circles and dashed grey line). For example, during constant amplitude cyclic loading of an SLB specimen under load control, the applied maximum load, P70,max, is kept constant while the displacement increases with increasing delamination length. For simulations performed under displacement control, the applied maximum displacement, u70,max, is kept constant while the load decreases as the delamination length increases. The maximum loads and the maximum displacements for fatigue load levels at 40%, 50%, 60% were also included in the plots of Figs. 8 and 9 (P40,max, P50,max, P60,max—horizontal lines; u40,max, u50,max, u60,max—vertical lines).

Maximum cyclic loads and applied displacements for a symmetric SLB specimen

Maximum cyclic loads and applied displacements for an unsymmetric SLB specimen
Variation of energy release rate with increasing delamination length
The energy release rates at different delamination lengths were calculated based on the static benchmark cases above. For an applied load level, u70,max, the energy release rate first increased with an increase in delamination length, a*, as shown in Fig. 10 (triangles and dashed dotted orange line) for the symmetric SLB specimen. After reaching a peak it decreased with increasing delamination length. Delamination growth was assumed to become unstable once the calculated energy release rate exceeded the fracture toughness value Gc (static benchmark case; solid circles and dashed grey line). For longer delamination length, a*, delamination growth was assumed to become stable again after the calculated energy release rate dropped below the fracture toughness value Gc. Additionally, the energy release rate dependence on the crack length was calculated for u60,max, u50,max, and u40,max, and the results were included in the plot of Fig. 10 (dashed lines with solid symbols). The curves follow the same trend as discussed for an applied load level, u70,max, however, for the lower load level u40,max, (red dashed line with solid symbols) the energy release rate does not reach the fracture toughness value, Gc, for any value of delamination length. Also included was the cutoff value, Gth, (green solid horizontal line). For the range of crack lengths considered here, 0.0 mm ≦ a* ≦ 45.0 mm, the computed energy release rates only dropped below the cutoff value for the lowest load level u40,max. Delamination growth was assumed to stop once the calculated energy release rate dropped below the cutoff value, Gth.

Energy release rate—delamination length behavior of symmetric SLB specimen for constant applied displacement
The computed dependence of the energy release rate with increase in delamination length, a*, for an unsymmetric SLB specimen is shown in Fig. 11. For all load levels considered the energy release rate first increased with an increase in delamination length, a*.

Energy release rate—delamination length behavior for unsymmetric SLB specimen for constant applied displacement
The calculated energy release rate values did not reach the fracture toughness value Gc (static benchmark case; solid circles and dashed grey line) for any delamination length. Thus, for all load levels considered, the delamination growth is assumed to be stable during cyclic loading for the unsymmetric SLB specimen. After reaching a peak the energy release rate decreased with increasing delamination length. After the delamination had increased about 20 to 25 mm in length the energy release rates dropped below the cutoff value, Gth. Delamination growth was assumed to stop once the calculated energy release rate dropped below the cutoff value, Gth.
Interpolation of mixed-mode delamination growth rates
Typically, the number of cycles during delamination growth, NG, can be obtained via integration of the delamination growth rate, da/dN, often expressed as a power law also referred to as Paris Law
where da/dN is the increase in delamination length per cycle and Gmax is the maximum energy release rate at the front at peak loading. The factor c and exponent n can be obtained by fitting the curve to the experimental data obtained from fatigue tests [11].
In previously published benchmark cases [6], the mode ratio, GII/GT, was independent of the delamination length and a single Paris Law (Eq. 2) could be used to first create the benchmark and second as input to the automated finite element based growth analysis. In practical applications, however, the crack growth rate may depend on mode mix, stress ratio, and R-curve effects [12]. In the SLB benchmark, as shown above, mixed-mode ratio varies with crack length. Since mixed-mode crack growth rates are not available for all mixed-mode ratios determined during crack propagation in the SLB benchmark, these crack growth rates must be interpolated from existing data. Thus, the mixed-mode crack growth rates may be characterized with the Mixed-Mode Bend (MMB) test under cyclic loading. Ratcliffe et al. [11] provided MMB crack growth rates for IM7/8552 CFRP material for 20%, 50% and 80% GII/GT mode mix. The propagation laws for 20% and 50% GII/GT that were used in the fatigue calculations for the symmetric and unsymmetric SLB specimens are shown in Figs. 12 and 13. The critical energy release rate or fracture toughness, Gc, is included in the plots. The cutoff value, Gth, below which delamination growth was assumed to stop, is also included in the plots.

Delamination growth rate (Paris Law) for 20% mode II

Delamination growth rate (Paris Law) for 50% mode II
Considering the various forms in which crack growth rate data may be published for various materials [12], a convenient interpolation scheme is necessary to calculate crack growth rates for a crack tip under arbitrary loading. The scheme that was used in a previous publication [9] was also used here for its simplicity and is demonstrated for the case where the unknown Paris Law for the symmetric SLB specimen (fixed 43% mode II as shown in Fig. 5) was obtained from the known growth relationship for 20% and 50% mode II shown in Figs. 12 and 13. The first step is to convert the known Paris Law data (Eq. 1) into log–log space such that
Which can be interpreted as the equation of a straight line
where
and
This operation was performed for the known growth laws for 20% (green line) and 50% mode II (blue line) using the Paris Law upper limit (Gc) and lower limit (Gth) points to determine the Xc, Yc and Xth and Yth values respectively as sketched in Fig. 14.

Interpolation of growth rate for unknown mixed-mode Paris Law
Now the Xc, Yc and Xth and Yth for 43% mode II can be linearly interpolated along the dashed lines. The upper and lower limits Gc, Gth and the corresponding da/dN values can be calculated by reversing the operation discussed in Eqs. (4) to (8) and the new Paris Law for 43% mode II can be determined (red line). The growth rate, da/dN, for a target point (red circle) with any computed combination of GT and mode ratio GII/GT can now be calculated. This scheme can easily be implemented into a spread sheet calculation or a software subroutine and was used to determine the Paris Laws for the symmetric (fixed 43% mode II) and unsymmetric (fixed 38% mode II) SLB specimen as shown in Figs. 15 and 16.

Interpolated growth rate (Paris Law) for 43% mode II

Interpolated growth rate (Paris Law) for 38% mode II
Note, that the interpolated growth rates shown in Figs. 15 and 16 were obtained using linear interpolation in log-space ranging from the threshold value, Gth, to the critical value, Gc. In practice, however, the threshold value may be difficult to determine experimentally and as a result is often times assumed. Linear interpolation in log-space may also not be compatible with an independent static fracture criterion and may lead to discrepancies e.g. if a BK criterion is used [13]. Thus, Gc obtained from an interpolated growth law may not be exactly the same as what is obtained from the BK-fit of the experimental data. A brief review of various other mode mix interpolation schemes for interlaminar fatigue delamination growth was performed in reference [11].
Fatigue delamination growth
For practical applications, Eq. (2) can be replaced by an incremental equivalent expression
where for the current study, increments of Δa = 0.1 mm were chosen. Starting at the initial delamination length, a0 = 10.16 mm, the energy release rates, Gi,max, were obtained for each increment, i, from the curve fits plotted in Figs. 10 and 11. These energy release rate values were then used to obtain the increase in delamination length per increment, Δa/ΔNi, from the respective Paris Law in Figs. 15 and 16. The number of cycles during delamination growth, NG, was calculated by summing the increments ΔNi
where k is the number of increments. The corresponding delamination length, a, was calculated by adding the incremental lengths, Δa, to the initial length, a0,
For the symmetric and unsymmetric SLB specimen, the delamination growth phase, is shown in Figs. 17 and 18, where the increase in delamination length, a*, is plotted for an increasing number of load cycles NG. Two sets of benchmark cases were created for each specimen. To create the first set, the interpolated growth rate shown in Fig. 15 (dashed lines) was used for the symmetric SLB specimen (43% mode II as shown in Fig. 5). For the unsymmetric SLB specimen (38% mode II as shown in Fig. 7) the interpolated growth rate shown in Fig. 16 (x and + symbols) was used. For the second set of benchmark cases, the dependence of mixed-mode ratio with crack length (Figs. 5 and 7) was considered (open symbols with thin dashed lines) and the growth rate, da/dN, was repeatedly calculated for each new growth increment Δa using the interpolation scheme discussed above (Fig. 14) which was implemented in a FORTRAN routine.

Delamination growth benchmarks for symmetric SLB specimen

Delamination growth benchmarks for unsymmetric SLB specimen
For the symmetric SLB specimen both sets of benchmark cases exhibit an initial slow growth phase which is followed by rapid growth where the curves become vertical for those displacement levels (u70,max, u60,max, and u50,max) where growth becomes unstable. For longer delamination lengths a phase of decreased growth is observed. Once a delamination length is reached where the energy release rate drops below the assumed cutoff value, Gth (as shown in Fig. 10), the delamination growth no longer follows the Paris Law and stops (horizontal dashed lines) as shown in Fig. 17. For the assessment of the finite element code as discussed later, it was assumed that delamination length increase during cyclic loading obtained from automated finite element analysis should closely match the growth shown in these benchmark examples.
For the unsymmetric SLB specimen both sets of benchmark cases exhibit an initial slow growth phase which is followed by more rapid growth but the curves never become vertical since this specimen does not exhibit unstable static growth. For longer delamination lengths a phase of decreased growth is observed similar to the symmetric SLB specimen. Once a delamination length is reached where the energy release rate drops below the assumed cutoff value, Gth (as shown in Fig. 11), the delamination growth no longer follows the Paris Law and stops (horizontal dotted lines) as shown in Fig. 18.
For the assessment of the finite element code as discussed later, it was assumed that the delamination length increase during cyclic loading obtained from automated finite element analysis should closely match the growth shown in these benchmark examples.
Assessment of results from automated fatigue growth analyses
With the ABAQUS® 2017 General Availability (GA) release, DS SIMULIA made available an additional procedure for quasi-static, low-cycle fatigue analysis of interfacial or bulk material crack growth under sub-critical cyclic loading. For short-hand, this new procedure will be referred to herein by its ABAQUS® keyword, *FATIGUE, to distinguish it from the existing low-cycle fatigue procedure, *DIRECT CYCLIC. At first, this procedure was included in ABAQUS® 2017 GA as an undocumented functionality to facilitate extended testing prior to fully documented support in subsequent ABAQUS® releases which became available with ABAQUS 2018 FD02 [6]. Additional functionally recommended by industry [12] became available with FD03 [8]. The new functionality includes
the option for tabular input of multiple growth laws that can depend on mode mix and stress ratio. During the analysis ABAQUS will interpolate between input data.
the option of a user subroutine to define the various forms in which crack growth rate data may be published for various materials [12].
output of the number of cycles that can be visualized as a contour plot in ABAQUS CAE such that each contour represents a delamination front shape after a particular number of cycles.
In the present section, the application of the benchmark is demonstrated and the delamination prediction capabilities implemented in ABAQUS Standard 2018 FD03Footnote 1 are assessed using the symmetric and unsymmetric SLB benchmark cases developed above. The effect of two different crack tip element sizes ∆a (∆a = 2 mm and 0.5 mm) on automated crack propagation results was investigated.
The parameters to define the load frequency (f = 3 Hz) and the load ratio (R = 0.1) were obtained from related characterization testing [11]. These parameters as well as the minimum and maximum applied displacement (umin and umax) were kept constant during all analyses. The input to define the fracture criterion and the parameters for delamination onset and delamination growth were also kept constant. Five specific example cases were investigated for the input using *FATIGUE:
Simplified amplitude definition
Case A: Standard input for a single growth law (Paris Law) including threshold, Gth, and static limit, Gc. This input option has been available since the first release of *FATIGUE and was also used for the older *DIRECTCYCLIC fatigue growth option in ABAQUS/Standard® [6, 8].
Case B: Single growth law only without threshold, Gth, and static limit, Gc using the new tabular input option.
Case C: Case B + threshold, Gth, and static limit, Gc.
Case D: Growth laws for GII/GT = 0.2 and 0.5 including respective thresholds and static limits using tabular input. Growth rates, da/dN, for other mixed-mode ratios (e.g. GII/GT = 0.43) are interpolated by ABAQUS/Standard® during the analysis [8].
Constant amplitude definition
Case E: Standard input for a single growth law (Paris Law) including threshold, Gth, and static limit, Gc identical to case A.
The details of the associated ABAQUS/Standard® input files are shown in Appendix for each of the five cases.
Results from growth analyses of the symmetric Single-Leg Bending specimen
In Figs. 19, 20, 21, 22, 23, the increase in delamination length, a*, is plotted versus the number of cycles, NG, for the symmetric SLB specimen. The results were obtained using 2D models and different ABAQUS growth law input options. The results in Fig. 19 were obtained using the single growth law option input discussed above (case A) which has been available since the first release of *FATIGUE. For all load levels, the results agree well with the benchmark solutions.

Computed delamination growth for unsymmetric SLB specimen (case A)

Computed delamination growth for symmetric SLB specimen (case A for u40,max, element length Δa = 0.5 mm and Δa = 2 mm)

Computed delamination growth for symmetric SLB specimen (cases B and C with ABAQUS tabular input for fixed GII/GT = 0.43)

Computed fatigue delamination growth for symmetric SLB specimen (case D for umax = 40%, 70% uc—ABAQUS tabular input for GII/GT = 0.2 and 0.5)

Top view of plane of delamination with computed growth contours obtained from 3D analysis of symmetric SLB specimen
The unstable static growth part, where the line becomes vertical, did not cause a problem in the analyses. Since the computations were limited to 2 million cycles, additional analyses may be required to investigate in more detail to verify the cutoff function gets captured correctly.
The results shown in Fig. 20 were computed for the benchmark case of an applied constant displacement u40,max (GII/GT = 0.43, dashed red line in Fig. 17). The results were obtained using the same input as discussed in the previous paragraph (case A). To ensure the results had not changed between releases, the analyses were performed using ABAQUS 2018 (open black circles) and ABAQUS 2018FD08 (open red circles). The results are identical. Additionally, an analysis was performed with a coarser mesh Δa = 2.0 mm. The results (filled red circles) indicate a pronounced mesh dependence. For the coarse mesh the growth rate da/dN is kept constant over 2 mm while for the fine mesh the growth rate is updated every 0.5 mm. Thus, slower growth is computed for the coarser mesh. Frequent updates become important when the energy release rate increases rapidly with crack length, as shown in Fig. 10, is modeled.
The results in Fig. 21 were obtained using the new tabular growth law input options which were made available as an enhancement in ABAQUS 2018 FD03 (detailed input is provided in Appendix). Using a tabular input for a fixed mixed-mode Paris Law (case B for GII/GT = 0.43) yields results (open blue circles) that are in good agreement with the benchmark for that portion where growth follows the Paris Law. This input, however, does not capture the threshold where growth is expected to stop. Also, the vertical segment of the benchmark curve, corresponding to unstable static propagation, is not computed correctly (open green circles). Improved results (open squares) were obtained by adding specific input related to the threshold, Gth, and the static limit, Gc, to the tabular input (see case C).
Additionally, results were obtained using the new tabular growth law input capability in ABAQUS (case D) as shown in Fig. 22. The propagation laws for 20% and 50% GII/GT shown in Figs. 12 and 13 were used as input to the analysis (detailed input is provided in Appendix). During the analysis ABAQUS interpolated between the known values to compute growth rates, da/dN, for intermediate mode ratios e.g. GII/GT = 0.43 or for mode ratios that were constantly changing with delamination length. The analyses yielded results (open symbols) that are in excellent agreement with the benchmark and captured the threshold where growth is expected to stop. Also, the unstable path where static propagation is reached was correctly predicted (open blue squares).
Analyses were also performed using the constant amplitude option of *FATIGUE (case E), where the cyclic loading has to be defined in more detail using the *AMPLITUDE input (detailed input is provided in Appendix). [8]. Results were obtained from 2D (see Fig. 2a) and 3D (see Fig. 3a) models. In order to obtain the increase in delamination length, a*, as a function of the number of cycles, NG, the new cycles output in ABAQUS was used for the 3D case as shown in Fig. 23. The cycles were displayed as contours and three distinct paths were created along which the number of cycles were retrieved.
The results are shown in Fig. 24, where the increase in delamination length, a*, is plotted versus the number of cycles, NG. The results from 2D analyses (solid circles) are in good agreement with the benchmark cases similar to the results obtained for the simplified cases shown in Fig. 21. For longer delamination lengths, however, growth stops prematurely. The results obtained from 3D analyses (open symbols) are in better agreement with the benchmark. Results from the three paths are almost identical, confirming an even, uniform growth across the width of the specimen as indicated by the contours in Fig. 23. Similar to the 2D results, growth appears to stop prematurely. In comparison, the 2D model appears to capture the stable growth better while the 3D model appears to yield better results for the unstable growth part. Further assessment to determine the cause of the discrepancies is required.

Computed delamination growth for symmetric SLB specimen obtained from 2D and 3D analyses (case E)
Results from growth analyses of the unsymmetric Single-Leg Bending specimen
In Fig. 25, the increase in delamination length, a*, is plotted versus the number of cycles, NG, for the unsymmetric SLB specimen. The results were obtained using 2D models and the single growth law option input (case A) which has been available since the first release of *FATIGUE (detailed input is provided in Appendix).

Computed fatigue delamination growth for unsymmetric SLB specimen (case A)
For all load levels, the results agree well with the benchmark solutions. For high number of cycles, growth stops and the last point on the curves was added manually to indicate the cutoff. This cutoff consistently occurred for longer crack lengths compared to the benchmark. More detailed investigation is necessary to find the source of this discrepancy.
Summary and conclusions
The development of VCCT-based benchmark examples used to assess the performance of fatigue delamination prediction capabilities in finite element codes was shown in detail for Single Leg Bending (SLB) specimens with equal and unequal bending arm thicknesses. The benchmarking procedure is independent of the analysis software. Benchmark solutions are based on Linear Elastic Fracture Mechanics (LEFM) and VCCT. The application was subsequently demonstrated for automated fatigue propagation analysis using newly implemented algorithms in the commercial finite element code ABAQUS Standard 2018FD03.
First, recently developed SLB-based benchmark cases for crack propagation prediction under quasi-static loading were discussed. Second, the development of new SLB-based benchmark cases to assess the growth prediction capabilities under cyclic loading and mixed-mode I/II conditions was discussed in detail. To be able to successfully address conditions where the growth law for a given mixed-mode ratio is unknown, a scheme was demonstrated for the SLB specimens that allows the calculation of the unknown growth rates based on interpolation from known data. Third, the delamination was allowed to propagate under fatigue loading from its initial location using the automated procedures implemented in ABAQUS 2018 FD03. New input options for the growth law were varied to study the effect on the computed delamination propagation. Further, a comparison was presented, in which the benchmark cases were used to assess new analysis tools in ABAQUS/Standard FD03.
Analysis benchmarking was successfully used to assess the performance of the new analysis tools. The results showed the following:
In general, good agreement between the results obtained from the fatigue growth propagation analysis and the benchmark results could be achieved by selecting the appropriate input parameters.
For ABAQUS 2018FD03 in particular, the results for automated delamination propagation analysis under cyclic loading showed the following:
Good agreement between analysis results and the benchmarks could be achieved when the threshold value, Gth, and static limit value, Gc, were included in the new tabular input.
Good agreement between analysis results and the benchmarks could also be achieved when ABAQUS interpolated the growth rates for a particular mixed-mode ratio from a set of known growth rates provided as tabular input.
Some discrepancies were observed when the analyses reached the cutoff value when delamination growth was expected to stop, prematurely or late.
Results appeared to be mesh size dependent, where larger element length resulted in slower delamination growth. Slower predicted growth was caused by the fact that delamination length dependent, increasing energy release rates where not updated frequently enough to accurately capture the increasing crack growth rates.
Overall, the benchmarking procedure proved valuable by highlighting the issues associated with choosing the appropriate input parameters for the VCCT implementations in ABAQUS 2018 FD03. In the context of analysis Verification and Validation (V&V), these benchmarks may also be used for code and calculation verification purposes and thus serve as a valuable tool for software developers. Specifically, these benchmark solutions should be used to evaluate other algorithms for delamination prediction, such as cohesive elements and adaptive mesh VCCT algorithms.
Additionally, further analyses are required to study the observed discrepancies between benchmark solution and results from automated delamination fatigue growth calculations in ABAQUS using the developed fatigue benchmarks. Subsequently, studies are required to validate the analyses against test results obtained from more complex specimens and on a structural level.
Availability of data and materials
The datasets behind graphs shown and analyzed during the current study are available from the corresponding author on reasonable request.
Notes
Improvements to the VCCT implementation in ABAQUS are ongoing and more recent releases have additional functionality. All releases mentioned in this paper are available to the public.
References
Tay TE. Characterization and analysis of delamination fracture in composites—an overview of developments from 1990 to 2001. Appl Mech Rev. 2003;56:1–32.
Raju IS, O’Brien TK. Fracture mechanics concepts, stress fields, strain energy release rates, delamination and growth criteria. In: Sridharan S, editor. Delamination behaviour of composites. Cambridge: Woodhead Publishing in Materials; 2008.
Rybicki EF, Kanninen MF. A finite element calculation of stress intensity factors by a modified crack closure integral. Eng Fract Mech. 1977;9:931–8.
Krueger R. The virtual crack closure technique for modelling interlaminar failure and delamination in advanced composite materials. In: Camanho P, Hallett S, editors. Numerical modelling of failure in advanced composite materials. Cambridge: Woodhead Publishing Ltd.; 2015. p. 3–53.
Krueger R. A summary of benchmark examples and their application to assess the performance of quasi-static delamination propagation prediction capabilities in finite element codes. J Compos Mater. 2015;49:3297–316.
Krueger R, Carvalho NVD, Sasdelli M. Searching for run-time efficient approaches to delamination growth predictions in composites. In: Proceedings of NAFEMS World Congress, Stockholm, Sweden; 2017.
Davidson BD, Sundararaman V. A single leg bending test for interfacial fracture toughness determination. Int J Fract. 1996;78:193–210.
ABAQUS analysis user’s guide. ABAQUS 2018 FD03, DS Simulia Corp., Providence, RI, USA; 2018.
Krueger R, Deobald L, Gu H. A benchmark example for delamination propagation predictions based on the single leg bending specimen under quasi-static and fatigue loading. In: Proceedings of 33rd ASC technical conference, Seattle, WA, USA; 2018.
Krueger R. Development and application of benchmark examples for mixed-mode I/II quasi-static delamination propagation predictions. NASA/CR-2012-217562; 2012.
Ratcliffe JG, Johnston WM. Influence of mixed mode I-mode II loading on fatigue delamination growth characteristics of a graphite epoxy tape laminate. In: Proceedings of American Society for composites 29th technical conference, San Diego, CA; 2014.
Deobald LR, et al. Guidelines for VCCT-based interlaminar fatigue and progressive failure finite element analysis. NASA/TM-2017-219663; 2017.
Benzeggagh ML, Kenane M. Measurement of mixed-mode delamination fracture toughness of unidirectional glass/epoxy composites with mixed-mode bending apparatus. Compos Sci Technol. 1996;56:439–49.
Acknowledgements
This research was supported by the Advanced Composites Project as part of NASA’s Advanced Air Vehicles Program under Award Nos. NNL09AA00A and 80LARC17C0004. Any opinions, findings, and conclusions or recommendations expressed in this material are those of the authors and do not necessarily reflect the views of the National Aeronautics and Space Administration.
Funding
This research was supported by the Advanced Composites Project as part of NASA’s Advanced Air Vehicles Program under Award Nos. NNL09AA00A and 80LARC17C0004.
Author information
Authors and Affiliations
Contributions
RK created the benchmark cases and performed 2D verification analyses, created all figures, wrote the paper and presented the work at the NAFEMS World Congress. LD developed the interpolation scheme discussed in Eqs. 3–8 and shown in Fig. 14 and provided general guidance for the project. HG created the 3D model shown in Fig. 3 and performed corresponding verification analyses. All authors read and approved the final manuscript.
Corresponding author
Ethics declarations
Competing interests
The authors declare that they have no competing interests.
Additional information
Publisher's Note
Springer Nature remains neutral with regard to jurisdictional claims in published maps and institutional affiliations.
Rights and permissions
Open Access This article is licensed under a Creative Commons Attribution 4.0 International License, which permits use, sharing, adaptation, distribution and reproduction in any medium or format, as long as you give appropriate credit to the original author(s) and the source, provide a link to the Creative Commons licence, and indicate if changes were made. The images or other third party material in this article are included in the article's Creative Commons licence, unless indicated otherwise in a credit line to the material. If material is not included in the article's Creative Commons licence and your intended use is not permitted by statutory regulation or exceeds the permitted use, you will need to obtain permission directly from the copyright holder. To view a copy of this licence, visit http://creativecommons.org/licenses/by/4.0/.
About this article

Cite this article
Krueger, R., Deobald, L. & Gu, H. A benchmark example for delamination growth predictions based on the Single Leg Bending specimen under fatigue loading. Adv. Model. and Simul. in Eng. Sci. 7, 11 (2020). https://doi.org/10.1186/s40323-020-00148-3
Received:
Accepted:
Published:
DOI: https://doi.org/10.1186/s40323-020-00148-3